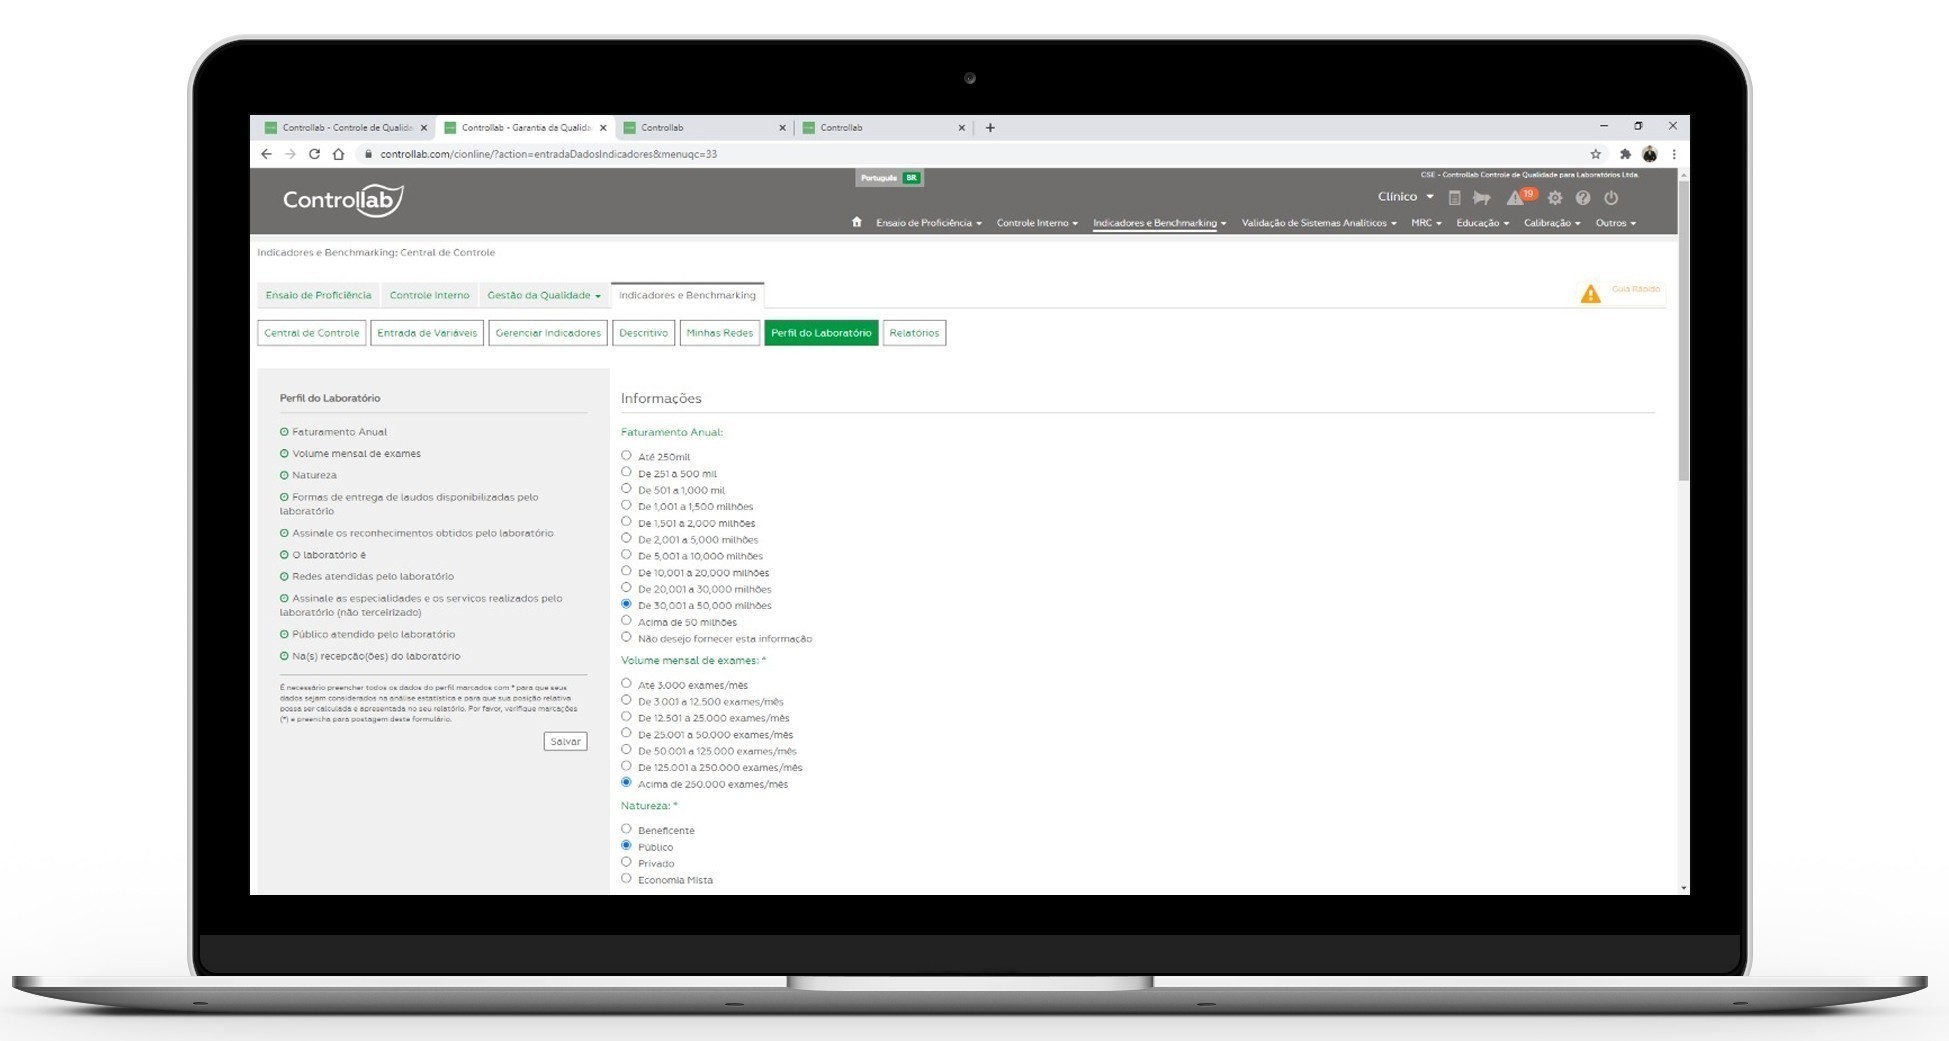
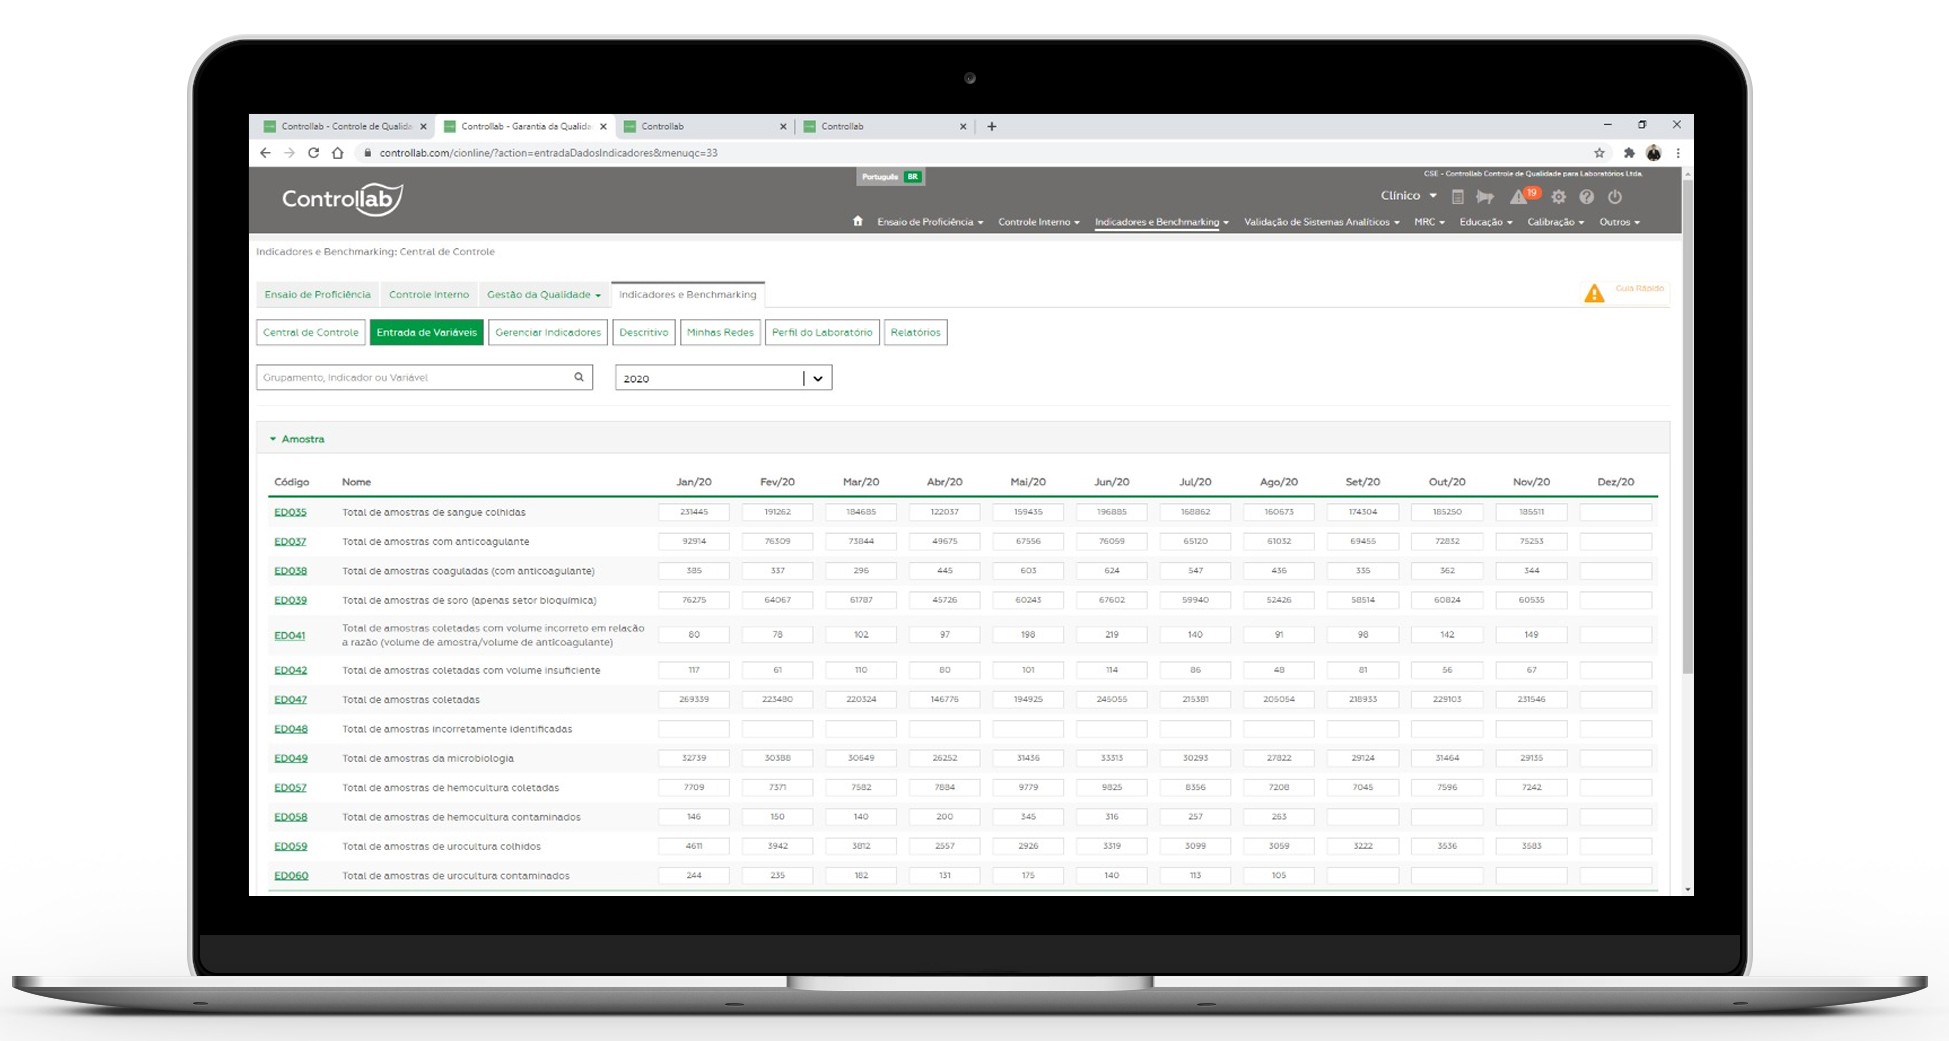
Benchmarking of Laboratory IndicatorsBenchmarking of Laboratory IndicatorsBenchmarking of Laboratory IndicatorsBenchmarking of Laboratory Indicators
  • Company
    • About
    • Our story
    • Structure
    • Solid Principles
    • Our Numbers
    • Quality Policy
    • Accreditations, Certifications and Qualifications
    • Partnerships
    • Identity Manual
  • Solutions
    • Proficiency Testing
    • Internal Control
    • Laboratory Indicator Benchmarking
    • Strains Control (Reference Strains)
    • Certified Reference Materials
    • Calibration of Instruments
    • Segments
      • Clinical
      • Hemotherapy
      • Veterinary
      • Microbiology
      • Physical-Chemical
      • Suppliers of in vitro diagnostic products
  • Catalog
  • Customers
  • Learning
    • Online Meeting
    • Talking About Event
    • Digitized Cases and Case Studies
    • Books
    • Scientific Articles
    • Boletins Informativos
  • News
  • Help
    • Novelty
  • Contact
  • +55 21 3891-9900
    CONTACT US
English
  • Portuguese (Brazil)
  • Spanish
LOG IN
✕
            No results See all results

            Benchmarking of Laboratory Indicators

            • Home
            • Solutions
            • Benchmarking of Laboratory Indicators
            Benchmarking Program and Laboratory Indicators (PBIL)
            INDICATORS THAT PROMOTE RESULTS

            The Laboratory Indicator Benchmarking Program (PBIL) helps to reduce costs and promote increased efficiency and productivity

            REQUEST CONTACT

            How does it help in the day-to-day of the laboratory?

            PBIL is a solution for laboratory management that promotes information for more assertive decisions. The tool improves processes, enhances performance, identifies new opportunities and keeps the organization sustainable.

            The information generated by the program encourages decision makers to gain a broader view of the results achieved for the process improvement and laboratory sustainability.

            Developed in partnership between the SBPC/ML – Brazilian Society of Clinical Pathology/Laboratory Medicine, Controllab partner since 1977.

            Concrete evidence of market process performance

            By participating in the PBIL, the laboratory identifies whether the efforts and strategies applied in the processes are competitive with their equals, based on hard evidence. This evidence helps to reduce costs, increase efficiency and productivity.

            This is because the program uses benchmarked indicators to measure and compare laboratory performance against market performance.

            pbil

            Data analyzed with impair and safety

            The indicators contemplated in the PBIL are correlated in all areas, providing a global and systemic view of the process.

            A multidisciplinary team (including statistics) reviews data reported in the program of Controllab, that acts as a third party company, imparting impartiality and confidentiality to reported data.

            Controllab follows a code of ethical conduct & compliance integrated with national and international laws for general data protection. The program has a detailed manual and description for the reliability and standardization of information.

            Privacy policy

            Benchmarking powered indicators

            São mais de 150 indicadores disponíveis para o laboratório. Para simplificar o levantamento de dados e melhorar o acesso às informações, empresas parceiras integram o LIS ao PBIL, promovendo mais agilidade nos processos e confiabilidade nas informações disponibilizadas em tempo real para a tomada de decisão.

            Resources

            Organizational

            Processes

            Demographic

            Download full list
            historico rastreamento

            History and tracking for certifications and accreditations

            Traceability in the PBIL system favors transparency for accreditations such as ISO 15189, CAP, PALC, DICQ and others, which require the demonstration of objective evidence that supports and assists the planning, monitoring and evaluation of process performance.

            Assess whether your laboratory processes are performed competitively

            In the Laboratory Indicator Benchmarking Program, the laboratory has a chance to compare with its equals and see if the actions taken over time are significant in relation to the market.

            imagem pbil

            Benchmarking program that collaborates with the improvement of the sector

            Ao participar, o laboratório aperfeiçoa o monitoramento de indicadores e há maior efetividade na gestão, ampliando o nível de segurança para gestores, profissionais de saúde e pacientes.

            By participating, the laboratory improves the monitoring of indicators and there is greater effectiveness in management, increasing the level of safety for managers, health professionals and patients.

            SBPC/ML and Controllab, in partnership with the Laboratory Indicator Benchmarking Program, are collaborating entities in the QUALISS – Qualification Program of Health Service Providers of ANS – National Agency of Supplementary Health.

            Broad and comprehensive
            indicator scope

            Internationally harmonized indicators aligned with IFCC

            Goal Setting to Achieve
            Determined Goals

            Advisory Group of Experts involved in monitoring the program

            Comparison between networks
            (support or brands)

            Integration with LIS providers to simplify data collection

            Participant laboratory profiles

            Some numbers prove the heterogeneity between laboratories, contributing to a robust benchmarking program.

            70 %
            these are laboratories that perform more than 50,000 exams/month
            86 %
            they attend the private health network
            14 %
            they attend the public health network
            69 %
            these are independent laboratories
            31 %
            these are laboratories based in hospital or blood bank

            +250

            Registered
            laboratories

            65

            International
            laboratories
            bg mapa pbil

            Ally in times of crisis management

            In times of crisis management, such as the one caused by the Covid-19 pandemic, the Laboratory Indicator Benchmarking Program (PBIL) becomes an ally to managers.

            In order to maintain reliable processes, avoid impacts on the quality of the results and protect the reputation of the institutions, the data obtained in the PBIL were fundamental to guide the managers’ decision. Having the measurement and knowledge of the weaknesses and strengths of the laboratory, were determining factors for agile decisions, amid scenarios of uncertainty.

            P

            Program operation

            Monthly, laboratories receive benchmarking from data reported or obtained directly from the Laboratory Information System (LIS).

            Upon registration, the laboratory receives a password to access to the Online System on the Controllab website.

            Profile
            Data entry
            Follow-up
            Benchmarking
            Profile

            perfil pbil

            The laboratory fills in the information that will compose its comparison profile (exam amount, target audience, nature, and other information that help it compare it with other organizations with similar characteristics). 

            Controllab’s statistical team uses laboratory profile information to recommend the best comparison group for their characteristics. The laboratories are compared among their equals.

            Data entry

            envio dados pbil
            Data reporting is ongoing and available for immediate access to information retrieval. They can be sent manually or via integration / interfacing with the laboratory’s LIS. When data is sent via integration / interfacing, the program automatically collects laboratory data and directly transmits the LIS information to the Controllab system. Integration provides more convenience for the routine, reducing the complexity of data collection and improving access to information. It promotes more process agility and data reliability. Allows real-time access to information for decision-making.
            The follow-up graph is automatically generated from the data reported monthly and allows you to check the behavior of the results over the periods.

            Follow-up

            acompanhamento pbil
            The follow-up graph is automatically generated from the monthly reported data and allows to check the behavior of the results over the periods.

            Benchmarking

            benchmarking pbil 1

            Monthly the laboratory visualizes in real time the market comparison of its results to define the priority actions to the organization’s strategies.

            The positioning of the laboratory in the market is indicated in the box plot graph. The Box plot is adopted for the graphical representation of the data because it allows an excellent visualization of the dispersion, symmetry, outlier barriers and outliers, regardless of the way the data is distributed. The Box plot is based on the median and quartiles, which reduces the impact of outliers and allows an excellent exploratory analysis. See how to interpret the result in the Box plot graph.

            Relative Equal Ranking and Sigma Metrics are applied to the results, where relevant, to encourage continuous improvement of laboratory processes.

            Results in Sigma Metrics: Indicates Process Quality

            Ranking: 1st are the best results and 5th the most sensitive results

            Quality and Sustainability for the Laboratory

            Partinership with LIS companies

            LIS developers integrate laboratory systems with PBIL to reduce data collection complexity and improve access to information, promoting faster process processes and reliability of real-time decision-making information.

            SEE THE BENEFITS OF INTEGRATING LIS WITH PBIL
            Allows

            it lets you focus on benchmarking results analysis

            Promotes

            data
            reliability

            Helps

            reduce data
            collection failures

            Reduces

            time in raw
            data monitoring

            PBIL PARTNERS

            Some developer companies, in addition to integrating LIS, promote the indicators in their systems to contribute to laboratory sustainability. These companies are PBIL partners.

            Confidentia

            "Vemos a integração do sistema do laboratório ao PBIL como uma grande possibilidade para que os menores laboratórios possam ter acesso facilitado a indicadores, já que eles têm mais dificuldade de investimento".

            Paulo Alexandre Simões Diretor Operacional - Confidentia

            Karyon

            "O maior benefício alcançado pela Karyon foi o de proporcionar aos nossos clientes uma análise comparativa de eficiência do laboratório nesse mercado cada vez mais competitivo".

            Durval Belém Diretor Comercial - Karyon

            Pixeon

            "Sempre que podemos fornecer soluções que contribuem para o desenvolvimento do setor laboratorial, através da nossa especialidade, sabemos que estamos no caminho certo! Estamos felizes com os resultados, pois, além do grande benefício para o setor de Medicina Diagnóstica, contamos com o compromisso desses parceiros em todos os momentos!”.

            Silvia Yano Gerente de Marketing - Matrix.

            Pixeon

            "O acesso a informação e o poder de facilitar a tomada de decisão bem embasada é o maior valor viabilizado pela nossa parceria".

            Armando Buchina CEO - Pixeon

            Previous
            Next

            mockup folder

            HAVE AN ENVIRONMENT WITH ANALYSIS OF EXCELLENCE

            Controllab offers complete solutions for quality and assertiveness of results. These solutions facilitate recognition for accreditation processes and regulatory bodies.
            Institutional Folder

            Related News

            August 30, 2021
            congresso virtual SBPC ML CP03 IND materia02WP EN 1
            August 30, 2021
            Categories
            • Events
            • Indicator Benchmarking
            • News

            Indicators and Laboratory Benchmarking is a course theme at the 2nd Virtual Congress of SBPC/ML

            The course will bring discussions on how the practice of benchmarking laboratory indicators is essential for the management of laboratories and as a support for decision […]
            Gostou disso?
            Leia mais
            July 14, 2021
            Matrix
            July 14, 2021
            Categories
            • Events
            • Indicator Benchmarking

            Controllab e Matrix promovem webinar com foco no Benchmarking de Indicadores

            Empresas unem especialistas no dia 22 de julho para compartilhar com os laboratórios como aplicar a estratégia de benchmarking de indicadores de forma simplificada Conhecer os […]
            Gostou disso?
            Leia mais
            June 28, 2021
            Benchmarking
            June 28, 2021
            Categories
            • Indicator Benchmarking
            • News

            SBPC/ML, Controllab and Matrix seal alliance to boost laboratory benchmarking

            Aware of the challenges and needs of the analysis laboratories, the institutions add their experiences towards the delivery of data that contribute to the improvement of […]
            Gostou disso?
            Leia mais

            Como podemos te ajudar?

            SUPORTE
            CONTATO

            Institutional

            About
            Our Story
            Structure
            Solid Principles
            Our Numbers
            Quality Policy
            Accreditations, Certifications and Qualifications
            Partnerships
            Identity Manual

            Solution

            Proficiency Testing
            Internal Control
            Laboratory Indicator Benchmarking
            Strains Control
            Certified Reference Materials
            Calibration of Instruments
            Segments

            News

            Highlights
            Solutions
            Clinical
            Chemical and Physical
            Supplier of Products
            Microbiology
            Others

            Support

            Central de AjudaHelp Center

            Phone+55 21 3891-9900
            +55 21 3613-5200

            WhatsApp+55 21 98258-0074

            Emailatendimento@controllab.com

            Emergency PhoneControllab Emergency

            +55 21 98036-1592

            • Privacy and Safety Policy
            • |
            • Help

            © Copyright 2021 Quality Control for Laboratories LTDA.

            LOG IN
            0

            R$ 0,00

            English
                      No results See all results
                      • English
                      • Portuguese (Brazil)
                      • Spanish
                      ✕

                      Carrinho

                      Your budget is currently empty.

                      Subtotal: R$ 0,00
                      Total: R$ 0,00
                      REVIEW QUOTE AND CONTACT INFORMATION View budget

                      Solicite o serviço de Benchmarking e conte com indicadores que promovem resultados efetivos para o laboratório.

                      Gestão de Recursos

                      Gestão de Equipamentos
                    • Índice de manutenção corretiva
                    • Tempo médio entre falhas: Equipamentos de bioquímica (MTBF)
                    • Gestão de Recursos Financeiros
                    • Despesa com pessoal
                    • Distribuição de despesas: Área física e recursos, Secundárias, Equipamentos, Materiais, Pessoal, Serviços e Transporte
                    • Glosa geral e por operadora
                    • Gestão de Recursos Humanos
                    • Absenteísmo
                    • Horas trabalhadas por funcionário
                    • Produtividade pessoal: Geral, Anatomia Patológica e Citopatologia, Faturamento, Recepção, Recepcionista, Técnica, Coletador próprio e franqueado
                    • Rotatividade: Geral e Recepção
                    • Treinamento: Cumprimento de carga de treinamento prevista, Eventos de capacitação, Horas de treinamento externa e interna
                    • Gestão de Recursos TI
                    • Eficiência do LIS: Episódios e Tempos de queda de sistema e Efetividade de liberação de resultados por auto verificação
                    • Gestão Organizacional

                      Gestão de Clientes e outras partes interessadas
                    • Manifestações de clientes recebidas e respondidas
                    • Satisfação de clientes: Pessoa Física e de médicos
                    • Net Promoter Score (NPS)
                    • Participação em pesquisa de Net Promoter Score (NPS)
                    • Indicadores de Processos

                      Pré-Analítico
                    • Erro de armazenamento: Armazenamento incorreto antes da análise
                    • Erro de transporte: amostras transportadas em temperatura incorreta, amostras com tempo excessivo de transporte, amostras avariadas durante o transporte e amostra não recebida
                    • Erro de coleta: Recipiente Incorreto, Volume Insuficiente, Proporção Incorreta do Volume de Amostra/Anticoagulante, Amostra Incorreta
                    • Amostras Coaguladas
                    • Contaminação: Amostras da microbiologia, Amostras de hemocultura e Amostras de urocultura
                    • Hemólise: Amostras em geral e na área de bioquímica
                    • Amostras com menos de 2 identificadores relacionados ao paciente
                    • Amostras com erro na identificação do paciente
                    • Amostras não identificadas
                    • Requisições com erro na identificação do paciente
                    • Exames incorretamente adicionados e que não estavam na requisição médica: Pacientes não internados e internados
                    • Exames não cadastrados: Pacientes não internados e internados
                    • Nome incorreto do exame: Pacientes não internados e internados
                    • Coleta em tempo inapropriado
                    • Requisições médicas inapropriadas relacionadas a questões clínicas informadas: Pacientes não internados e internados
                    • Requisições médicas sem questões clínicas: Pacientes não internados
                    • Requisições médicas não inteligíveis: Pacientes não internados e internados
                    • TAT Fase pré-analítica (por exame)
                    • Analítico
                    • Erros de transcrição de resultados por falha do LIS
                    • Erros em transcrição manual de resultados
                    • Ensaio de Proficiência: Desempenho inadequado relacionado a causa previamente tratada
                    • Ensaio de Proficiência: Desempenho inadequado
                    • Controle Interno: Testes com resultados fora das especificações
                    • Controle Interno: EA por Exame, EA por Exame/Equipamento e EA por Reagente/Lote
                    • Produção técnica por exame e por equipamento
                    • Tubos coletados por paciente: Geral e estratificado por tipo de tubo
                    • Exames por tubo: Geral e estratificado por tipo de tubo
                    • TAT Fase analítica (por exame)
                    • Pós-Analítico
                    • Laudos não acessados
                    • Índice de comentários interpretativos em laudo
                    • Laudos Incorretos
                    • Insucesso na comunicação de resultados críticos
                    • Comunicação de resultados críticos com atraso: Pacientes não internados e internados
                    • Tempo médio para comunicação de resultados críticos: Pacientes não internados e internados
                    • Atraso de resultados: Paciente não internados
                    • TAT Percentil 90: INR, Potássio, Troponina e WBC
                    • TAT Global (por exame)
                    • TAT Fase pós analítica (por exame)
                    • Efetividade / Outcome
                    • Recoleta: Geral e estratificada, Pacientes não internados e internados
                    • Resultados incorretos liberados
                    • Segurança
                    • Acidente com perfurocortante
                    • Acidente de trabalho: Geral
                    • Indicadores Demográficos

                    • Entrega de laudo: Por e-mail, por web, no domicílio, por telefone ou fax e retirado no laboratório
                    • Exames por paciente Geral e estratificado por público, particular e convênio
                    • Públicos atendidos, Pacientes não internados e internados
                    • Sistemática de coleta: Pacientes próprios, de terceiros e de franquia
                    • Terceirização
                    • Ticket médio
                    • Volume de exames: Particular, operadora, rede pública e cortesia
                    • Request the benchmarking service and count on indicators that promote effective results for the laboratory.

                      Resources Management

                      Equipment Management
                    • Corrective maintenance index
                    • Mean time between failures: Biochemistry equipment (MTBF)
                    • Financial Resources Management
                    • Staff expenses
                    • Distribution of the expenditure
                    • Disallowances general and by operator
                    • Human Resource Management
                    • Absenteeism
                    • Hours worked
                    • Personal Productivity: General, Pathological Anatomy and Cytopathology, Billing, Reception, Receptionist, Technique, Own and franchised collector
                    • Rotativity: General and Reception
                    • Training: Enforcement of planned training load, Training events, Hour of training and Internal training
                    • IT Resource Management
                    • LIS Efficiency: Episodes of system crash, Self-Check Results Efficiency and Times of system crash
                    • Organizational Management

                      Customer Management and other stakeholders
                    • Received and responded Customer Manifestations
                    • Customer Satisfaction: Individual and Physician
                    • Net Promoter Score (NPS)
                    • Participation in research of Net Promoter Score (NPS)
                    • Process Indicators

                      Pre-Analytical
                    • Storage error: Incorrect storage before scanning
                    • Transport error: Samples damaged during transport, Samples with excessive transport time, Samples transported at incorrect temperature
                    • Collection Error: Incorrect container, Volume Insuficiente, Proporção Incorreta do Volume de Amostra/Anticoagulante, Incorrect Sample
                    • Coagulated Samples
                    • Contamination: Samples of microbiology, Hemoculture samples and urine culture samples
                    • Hemolysis: Samples in general
                    • Samples with less than 2 patient-related identifiers
                    • Samples with error in patient identification
                    • Unidentified samples
                    • Errors in patient identification
                    • Tests incorrectly added and not included in the medical requisition: Non-hospitalized and hospitalized
                    • Exams not registered: Non-hospitalized and hospitalized
                    • Incorrect exams name: Non-hospitalized and hospitalized
                    • Collection in inappropriate time
                    • Inappropriate medical requests related to informed clinical issues: Non-hospitalized and hospitalized
                    • Medical requests without clinical questions: Non-hospitalized
                    • Non-intelligible medical requests: Non-hospitalized and hospitalized
                    • TAT preanalytical by exams
                    • Analytical
                    • Transcription errors of results due to LIS failure
                    • Errors in manual transcription of results
                    • EP: Inadequate performance related to previously treated cause
                    • EP: Inappropriate Performance
                    • CI: Tests with out-of-specification results
                    • Internal Control: EA per exam, EA per exam/Equipment and EA per reagent/batch
                    • Technical production by exam and by equipment
                    • Tubes collected per patient: General and laminated
                    • Tube exams: General and laminated
                    • TAT analytical phase by exams
                    • Post-Analytical
                    • Unpublished reports
                    • Index of interpretive comments in report
                    • Incorrect reports
                    • Failure to communicate critical results
                    • Communication of late critical results: Non-hospitalized and hospitalized Patients
                    • Average time for reporting critical outcomes: Non-hospitalized and hospitalized Patients
                    • Delayed Outcomes: Non-hospitalized Patients
                    • TAT: INR, Potassium, Troponin and WBC
                    • TAT Global by exam: General
                    • TAT post-analytical phase by exams
                    • Effectiveness / Outcome
                    • Recollect: General, Non-hospitalized and hospitalized Patients
                    • Incorrect results released
                    • Safety
                    • Accidents with sharps
                    • Accident at work: General
                    • Demoraphic Indicators

                    • Report delivery
                    • Exams per patient
                    • Audited publics
                    • Collection systematics
                    • Outsourcing
                    • Average ticket
                    • Volume of exams
                    • Como interpretar o resultado no gráfico Box plot?

                      Para formar o Box plot, todos os dados enviados são ordenados em ordem crescente e os quartis são definidos da seguinte forma: o segundo quartil, que representa a mediana (50% dos dados) é onde se encontra o dado central, ou seja, há metade dos resultados que são inferiores e outra metade que são superiores a este. Com a metade dos dados inferiores, é feito o mesmo procedimento, ou seja, o elemento central representa o primeiro quartil (25% dos dados) e o mesmo ocorre com os dados superiores, definindo-se assim o terceiro quartil (75% dos dados).

                      Junto a cada gráfico, há uma tabela com o número de participantes que contribuíram para a construção do gráfico, a mediana, 1º e 3º quartis e os valores mínimo e máximo, conforme a segmentação adotada.

                      O posicionamento do laboratório frente ao mercado é sinalizado no gráfico Box plot com um círculo vermelho.

                      Ao analisar o gráfico, é importante verificar inicialmente onde o seu resultado se encontra e definir internamente se é necessário tomar alguma ação interna para melhoria desse resultado. Se seu resultado for um outlier (muito diferente dos demais), é importante conferir os dados fornecidos para ter certeza de que não houve erro de reporte de dados.

                      Contact us
                      Whatsapp
                      We use cookies and other similar technologies to improve your experience, enabling a more personalized navigation, according to the characteristics and your interest. For more information see our Privacy and Security Policy.
                      I AGREE

                      PRM 0009

                      Accreditation Cgcre/Inmetro - Certified Reference Material Producer

                      Controllab has been accredited as a Certified Reference Material Producer (MRC) since 2016 by Inmetro’s General Coordination for Accreditation (CGCRE), under the PMR 0009 number. The assessment of this conformity is carried out according to the requirements established in ABNT NBR standards ISO 17034 and Inmetro, thus ensuring competence for the production of MRCs, according to the Scope of Accreditation.
                      view certificate
                      access accredited scope
                      Cgcre is signatory to the Mutual Recognition Arrangements of the International Laboratory Accreditation Cooperation (ILAC) and Interamerican Accreditation Cooperation (IAAC).

                      CAL 0214

                      Accreditation Cgcre/Inmetro - Calibration Laboratory

                      In December 2002, the Calibration Laboratory was accredited by Inmetro’s General Coordination for Accreditation (CGCRE). With this recognition, it became an integral part of the Brazilian network of accredited laboratories, under nº214. Since then, it is periodically evaluated for the maintenance and/or extension of accreditation.

                      view certificate
                      access accredited scope - RBC/Cgcre/Inmetro - Physical-Chemical
                      access accredited scope - RBC/Cgcre/Inmetro - Massa
                      access accredited scope - RBC/Cgcre/Inmetro - Volume and Specific Mass
                      access accredited scope - RBC/Cgcre/Inmetro - Pressure
                      access accredited scope - RBC/Cgcre/Inmetro - Temperature
                      Cgcre is signatory to the Mutual Recognition Arrangements of the International Laboratory Accreditation Cooperation (ILAC) and Interamerican Accreditation Cooperation (IAAC).

                      PEP 0003

                      Accreditation Cgcre/Inmetro - Proficiency Test Provider

                      In September 2011, Controllab was accredited by Inmetro’s General Coordination for Accreditation (CGCRE) as a proficiency test provider, under nº PEP0003. Initially as part of a pilot project by Inmetro, this accreditation was based on ILAC G13: 2007 and included several clinical and hemotherapy tests. In the periodic evaluations of this accreditation, new segments and tests are included and the evaluation is now conducted according to ABNT NBR ISO/IEC 17043.

                      This accreditation attests to Controllab’s technical competence to develop and conduct proficiency tests in accordance with international requirements and enables it to be recognized in other countries, in accordance with mutual recognition agreements signed by Brazil in Mercosur, the Americas and Europe.

                      view certificate
                      access accredited scope

                      Cgcre is signatory to the Mutual Recognition Arrangements of the International Laboratory Accreditation Cooperation (ILAC) and Interamerican Accreditation Cooperation (IAAC).